In the field of statistics, you usually differ between two types: descriptive statistics and inferential statistics. Both of them are equally important for a study, as the descriptive kind typically pose the baseline for inferential statistics, describing the facts and parameters. This article will follow the principles and ideas of descriptive statistics in detail, explaining all relevant information.
Definition: Descriptive statistics
Descriptive statistics is the analysis of data in quantitative research. This methodology offers a detailed summary and interpretation of the data, using measures such as central tendency, variability, or frequency distribution to provide insights about the sample. For example, descriptive statistics summarizes the sample data using charts, tables, or graphs. Therefore, it helps researchers understand the data better.
Types of descriptive statistics
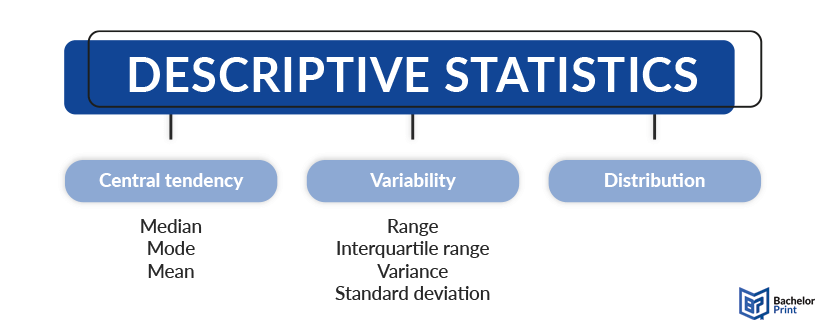
Descriptive statistics consists of three main topics: central tendency, variability, and frequency distribution, which will be explained in the following.
The measures of central tendency are the core of descriptive statistics. They include the median, the mode, and the mean, of which the latter one can be divided into the arithmetic mean and the geometric mean.
| Median | Middle value of a sorted dataset |
| Mode | Most frequent value in the dataset |
| Arithmetic mean | Sum of values divided by the number of values |
| Geometric mean | n^th root of multiplying all values |
Measures of variability describe to what extent the data in a set varies and how big the differences are. They include the range of data, the interquartile range, the variance and the standard deviation.
| Range of data | Difference between the biggest and the smallest value |
| Interquartile range | Difference between the first and the second quartile |
| Variance | Average squared deviation of individual data points from the mean |
| Standard deviation | Average deviation of data points from the mean |
Note: When talking about the “mean” in statistics, usually the arithmetic mean is meant. The geometric mean is a more precise measure in huge datasets with great variability and not often used in simpler studies, such as those for a thesis or dissertation.
Frequency distributions often visualize the spread of data or divide it into categories to achieve an overview of the dataset in the simplest manner. They include categories or intervals, relative frequencies/percentages, diagrams, and more.

Descriptive statistics vs. inferential statistics
The difference between descriptive statistics and inferential statistics lies in their function and methodology. For instance, descriptive statistics use summary statistics, tables, and graphs to describe the values in a data set. Therefore, it helps a researcher understand the dataset easily and quickly. On the other hand, inferential statistics uses a small sample of data to draw deductions or inferences about a larger population from which the sample is collected.
Example
The following example illustrates, what a descriptive statistic can look like in a study.
FAQs
Descriptive statistics are measures and data categorizations, which merely describe the data quantitatively. They do not interpret or analyze the results, but only state them. The counterpart are inferential statistics, which use descriptive measures and other processes, to further analyze the data gathered in a study.
Descriptive statistics, as the name suggests, merely describe the dataset in quantitative numbers and measures. They do not analyze or interpret the findings. This is then the task of inferential statistics, which use the data gathered to draw conclusions and support arguments by interpretation and analyses of the data.
The main fields of descriptive statistics are central tendency, including the mode, median, and mean; variability, consisting of range, interquartile range, variance and standard deviation; as well as frequency distributions and visual representations such as diagrams or percentages.
The three types are distribution, measures of central tendency, and measures of variability.
Printing Your Thesis With BachelorPrint
- High-quality bindings with customizable embossing
- 3D live preview to check your work before ordering
- Free express delivery
Configure your binding now!