In inventory management, it can be pretty challenging to deal with several suppliers and thousands of parts. That is why your organization’s personnel must find a way to deal with items in terms of priority and their impact on inventory cost. This is where the ABC analysis comes in. This article covers this type of methodology in detail to equip you with all the information on the inventory management tool and help you perform the analysis successfully for your business.
Definition: ABC analysis
ABC analysis is an inventory management tool used in materials management and supply chain management. The ABC analysis classifies items in inventory into three categories based on their value to the business:
| Class | Number of items | Value of items |
| A (most valuable) | 20% | 70% |
| B (moderate value) | 30% | 25% |
| C (least valuable) | 50% | 5% |
The ABC analysis for inventory helps organizations prioritize their inventory management efforts, focusing resources on managing A items closely while applying less stringent controls to B and C items. This approach aims to optimize inventory levels, reduce carrying costs, increase the efficiency of inventory management, which leads to an improved inventory control. It makes it easier to distribute man-hour requirements and capital resources, and may even transform your mindset in business decisions.
- A items are the most important. They’re like your phone or wallet, things you use all the time and are very valuable. These require close attention and regular checks because they comprise the bulk of your needs or costs, but are usually a smaller portion of your stuff.
- B items are in the middle. They’re like your favorite books or a nice pair of shoes. You don’t use them as often as your phone, but they’re still significant. They require a moderate level of management.
- C items are the least essential. They’re like old magazines or souvenir mugs. They’re enjoyable to have, but they don’t need as much attention because they’re less frequently used or less costly, yet they form the majority of your items.
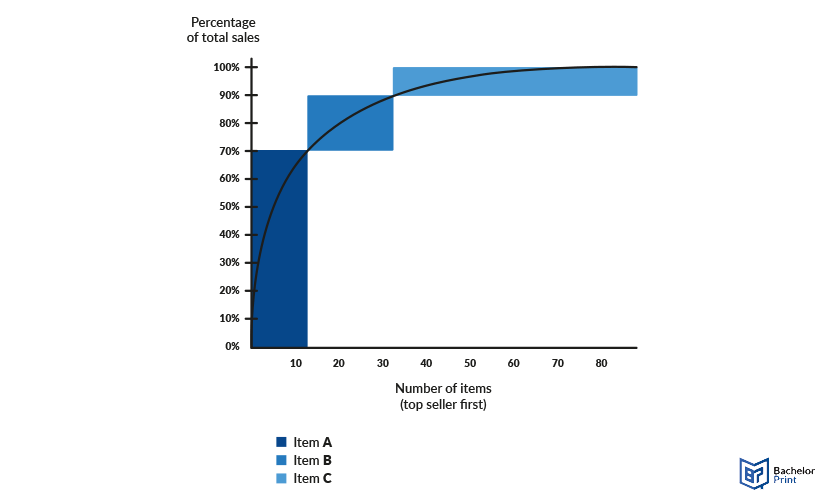
ABC analysis of inventory
As illustrated above, the ABC inventory analysis is for inventory management method to determine the value of inventory items and their significance for the business. These items are ranked based on demand as well as demand and risk data. This classification aids leaders in identifying the products or services vital to their organization’s financial success.
Typically, the inventory items of the ABC analysis of inventory are categorized into three classes. While A items are the most critical stock-keeping units (SKUs) due to high sales volume or profitability, B and C items are considered less important. Some businesses use even more than these three categories and go beyond (e.g., A to F).
Process
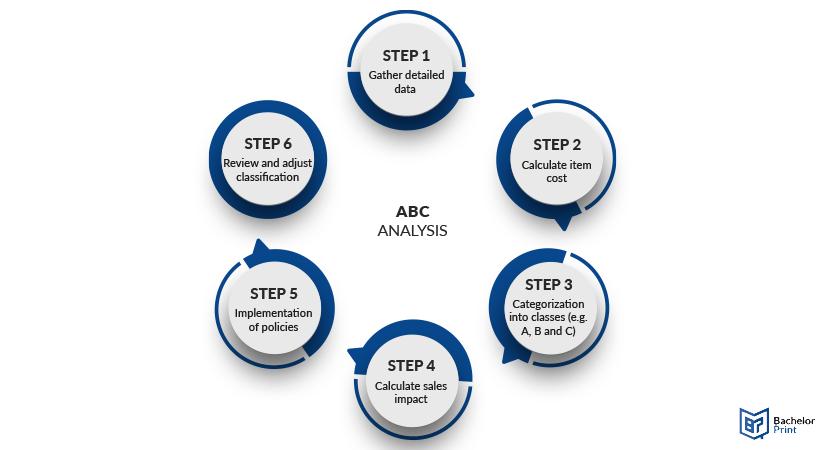
Now, the question of how to perform an ABC analysis remains. We’ll give you a guide to inventory management below. This section is followed by an ABC analysis example to illustrate the method and make it more tangible. Before starting, you need an objective you’re trying to reach. Generally, there are two goals you can reach: Lower procurement costs or a rise in the cash flow.
Collect detailed data for each inventory item, such as the inventory records. This includes sales volume, purchase cost, and any other relevant factors like demand variability or replacement frequency. Some businesses use alert inventory teams or an inventory controller specifically for this task.
Determine the annual consumption value of each item by multiplying the annual item demand by the item cost. This will help you assess the financial impact of each item on your inventory.
Formula
(Annual number of items sold) x (Cost per item) = (Annual usage value per product)
Order the items from highest to lowest based on their calculated annual consumption value. This ranking will highlight which items contribute most to your business.
- Class A = Most valuable
- Class B = Moderately valuable
- Class C = Least valuable
Some businesses prefer to extend this concept by adding more classes, e.g., you can add categories D to F.
Now, you calculate the sales impact for each inventory item. This helps identify which items are most valuable in terms of sales, allowing you to allocate resources and make decisions that align with your business’s sales and profitability goals. Here’s the formula.
Formula
(Annual item cost) / (Aggregated total of all items spent) x 100 = % of impact
Develop and implement different inventory management policies for each class. As you can see below, category A describes items on demand. They should always be in stock.
| A | B | C |
|
|
|
Regularly review the ABC classification, at least annually, or more often if your market conditions change frequently. Adjust the categorization as needed based on updated sales data, changing costs, or shifts in demand patterns.
Note: While related in acronym, ABC inventory analysis is distinct from activity-based costing used in cost accounting. The latter is a method of assigning overhead and indirect costs to products and services based on the activities they require, which is essential for accurately calculating profitability but separate from inventory categorization.
Tips
Applying an ABC inventory analysis effectively or using it in any other area requires adherence to several best practices. These ensure that the analysis provides meaningful insights and supports strategic decision-making.
- Regularly review and update your inventory
- Reclassify purposefully to be flexible with changes in your customer base
- Use accurate data for your analysis
- Combine techniques for comprehensive results
- Implement a category-specific inventory strategy
- Collaboration to ensure diverse insights and more accurate categorization
- Technology to streamline the process and keep data up-to-date
- Educate your team to ensure consistent implementation
- Customize to fit your business’s goals and challenges
Example
For our exemplary Gourmet Coffee Shop with ten items, here’s how the ABC-based inventory management pans out, including annual demand, cost per unit, annual cost, percentage of sales impact, and the classification of each item.
Here are our ten different key products.
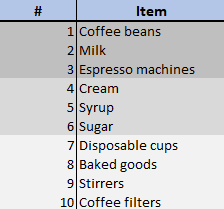
Next, we’ll determine the amount of the item that is being demanded each year and how much each unit of said item cost.
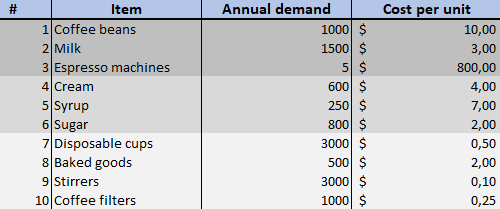
In the following two steps, we calculate the annual usage value per product and the percentage of the sales impact using the formulas found in the process of the ABC analysis.

The final step involves categorizing the items in the three different classes A, B, and C. We drew the line at 14% and 5.5% as illustrated by the table below.

This classification requires a careful analysis of inventory data. If done correctly, the coffee shop benefits from an overview of the average inventory levels as well as reduce the risk of unnecessary inventory. This, in turn, reduces inventory inefficiencies by focusing on Class A items that have the highest sales impact, followed by managing Class B items with moderate importance, and maintaining adequate stock levels of Class C items. This leads to an improved inventory control.
Why use an ABC analysis?
It is an important tool for businesses since it helps them maintain control of costly items and requires a large capital to invest in. Besides, the ABC analysis technique aids in reducing or avoiding storage expenses and helps businesses maintain an optimum level of stock at all times, which helps reduce staff expenses.
ABC analysis in inventory management ensures that the stock turnover ratio is kept at a higher level through systematic inventory control. Furthermore, it gives room for the maintenance of enough C items without compromising indispensable products.
Limitations
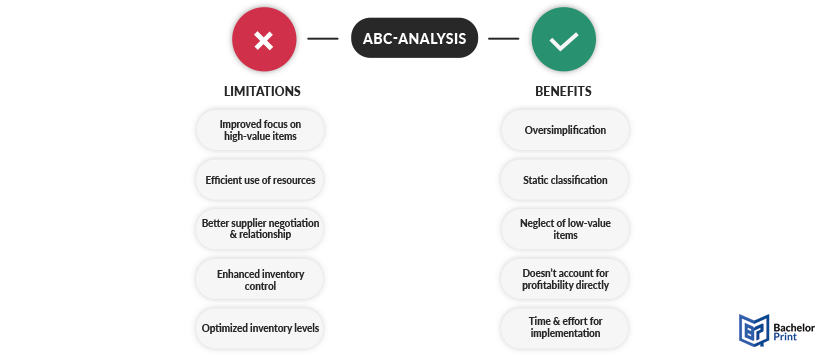
Despite the many benefits for inventory maintenance, the ABC analysis has numerous limitations as well. Below, we’ll discuss the limitations of inventory classification.
- It can oversimplify inventory complexities. For instance, it might not fully account for items with seasonal demand or those that are critical but don’t necessarily have high sales value.
- The ABC classification can become outdated as market conditions, product life cycles, and consumer preferences change. Regular review and reclassification are necessary, which can be resource-intensive.
- While focusing on high-value items, there’s a risk of neglecting C items, which can be crucial for customer satisfaction or could potentially become A items in the future.
- It primarily focuses on inventory value or inventory turnover rates but doesn’t directly consider the profitability of items, which can lead to prioritizing high-turnover items that have low profit
- The initial setup requires significant data collection and analysis of the inventory records, which might be challenging for businesses without the necessary tools or expertise.
Benefits
There’s a long list of benefits resulting from the application of the ABC analysis to inventory management.
- By identifying A items, businesses can focus their efforts and resources on the inventory that contributes most significantly to their bottom line, ensuring these items are always in stock and managed carefully.
- Inventory management efforts are prioritized, allowing businesses to allocate their time, workforce, and financial resources more efficiently. Thus, cost savings can be achieved in inventory management.
- Understanding which items are critical to your business can help in negotiating better terms with suppliers, such as pricing, delivery schedules, and minimum order quantities for high-priority items.
- By categorizing its importance, businesses can apply different control mechanisms for each inventory category, reducing the risk of overstocking unnecessary inventory or stockouts, especially for high-value items.
- ABC analysis assists in maintaining optimal inventory levels, balancing the need to meet customer demand patterns against the cost of carrying excess inventory.
Uses
ABC analysis is a versatile tool that finds application across various fields, each adapting the methodology to suit specific needs and objectives.
Here, the ABC analysis helps businesses prioritize their inventory management efforts, focusing on A items to ensure optimal stock levels, reduce carrying costs, and improve order accuracy. It guides strategies for procurement, stock replenishment, and even marketing and sales efforts by highlighting which items deserve the most attention and resources.
Healthcare
- To manage their medical supplies and pharmaceuticals, ensuring critical life-saving drugs (A items) are always available, while also efficiently managing less critical supplies (B and C items).
Manufacturing
- Identifies critical components and raw materials that directly affect production efficiency and product quality, ensuring a smooth production process and timely delivery of finished products.
Retail
- Assists in optimizing product placement, marketing strategies, and stock levels to focus on high-value items that drive sales and customer traffic.
In academic writing, researchers and scholars use ABC analysis to prioritize literature or sources. A sources are foundational texts or seminal works that are crucial to the argument or theory being developed. B sources provide supporting evidence or offer important insights, while C sources might be used for background information or to provide context.
History
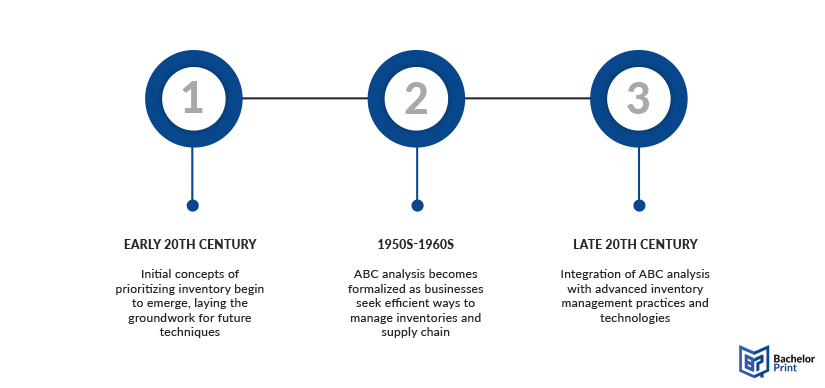
These points reflect the evolution of ABC analysis from its conceptual beginnings to its establishment as a fundamental tool in inventory and supply chain management.
Early 20th century
- Initial concepts of prioritizing inventory begin to emerge, laying the groundwork for future inventory management techniques.
1950s – 1960s
- ABC analysis becomes formalized as businesses seek efficient ways to manage inventories and supply chains. This period marks the widespread adoption of the method, influenced by the Pareto Principle, founded by its namesake Vilfredo Pareto, which was introduced in the late 19th century but applied to inventory management during this era.
Late 20th century
- Integration of ABC analysis with classified item inventory management and technologies, such as ERP systems and JIT inventory, enhances its effectiveness and utility in business operations.
FAQs
ABC analysis is a method of categorizing inventory into three groups based on their importance and impact on overall costs or annual sales. A items are the most valuable, requiring close attention, B items are of moderate value, and C items are the least valuable but often the most numerous.
A real-life ABC analysis example is in a retail clothing store.
- A items might be high-end designer dresses that generate the most profit.
- B items could be popular seasonal apparel like jackets or swimsuits.
- C items might be basic accessories like socks or inexpensive jewelry.
The ABC analysis involves three segments, A, B, and C. Therefore, items that fall under segment C are slow-moving items, and thus, should not be re-ordered at the same frequency as those in the segment and segment B.
The ABC analysis is used in stock checking, inventory systems, and supply chain management and acts as a cycle counting tool. It is vital for businesses that seek to reduce their carrying costs and working capital. This is achieved by analyzing inventory, which is in excess stock, and the obsolete ones by paving the way for readily sold items. This will aid in availing working capital for use instead of keeping it tied to unhealthy inventory.
It requires proper standardization for materials stored for it to work and yield successful results. It also needs a good coding system of materials in operation for it to work. Furthermore, it considers the monetary value of items and ignores other factors that may be more beneficial for your business.
The ABC model categorizes goods into A, B, and C. Goods in A record the highest value regarding annual requirements. Items in B have a medium consumption value, amounting to 30% of the entire inventory. Items in category C have the lowest consumption value, and hence account for just 5% of annual customer sales. Supply managers should prioritize items with the highest product value and minimize those with low value.
