The field of statistics includes many intriguing and complex quantities as useful tools to calculate all sorts of probabilities and results. One of the most used measures in statistical tests is hypothesis testing, where you determine which of two hypotheses is more plausible. To calculate the required test statistic, you also need the standard error, which will be explained thoroughly in the following article.
Definition: Standard error
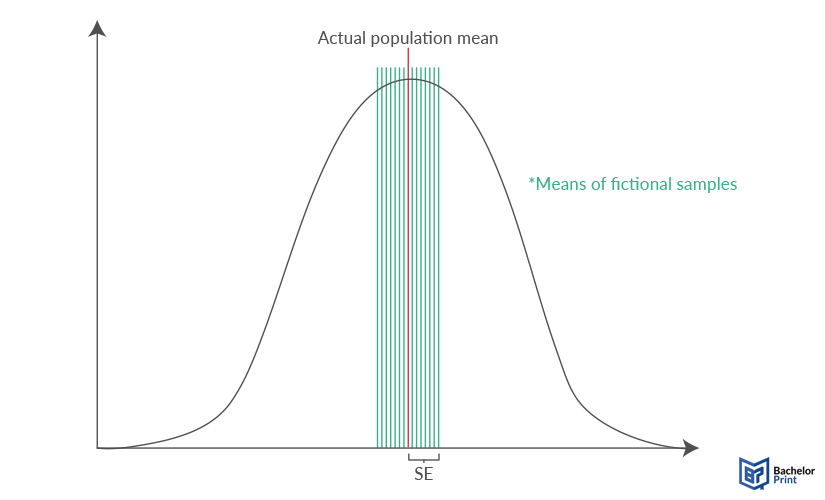
The standard error (SE) describes the deviation of a calculated estimated value from the actual estimated value of the entire population. Therefore, the standard deviation σ is divided by the square root of the sample size n. It finds application, especially in hypothesis testing, when establishing confidence intervals, and in inferential statistics, serving as a measure of reliability and accuracy of the results.
The SE thus estimates how much the mean of samples (same size n from the same population) would vary from the actual population mean, without actually conducting more than one sample study. While the mean is the most used example, the standard error, as well as the standard deviation, can measure the variability around any statistical parameter such as the median, the expected value, etc.

Types
There are three different types of standard error: The standard error of the mean, of the estimate and of the measurement, which are briefly explained below. The SEM, however, is the most used of them all.
| Definition | |
| Deviation of the (predicted) sample means from the actual mean of the entire population, without needing more than one sample. | |
| SE of the Estimate | The difference between the actual value of the dependent variable and its predicted value based on the multiple regression model. |
| SE of Measurement | The assessment of how much test scores that are measurable deviate from a known, so-called, 'true' measurement. |
Interpretation and Report
Besides knowing how to calculate the standard error, realising its worth and being able to interpret it correctly before reporting it in your thesis or study summary is just as important.
Importance
Showing the SE of a sample is important in statistics because it means someone reading the data can gain a clear understanding of how representative it is, compared to the wider population the sample has been taken from. When you collect a sample randomly, you cannot know beforehand how representative the sample is.
Interpretation
After calculating the standard error, you also need to know what the result means. Generally, the lower the SE is, the better because this means that the distribution is not widely dispersed and thus more reliable. Statisticians can help to lower the SE of their data by taking larger samples, thereby minimizing bias.
| High Standard Error | Low Standard Error |
| • The sample data does not match the population • Hypotheses drawn from the sample are not valid |
• The sample data matches the population closely • Hypotheses drawn from the sample are more valid |
Report
Typically, SE is reported after the mean average of a set of data is given with a plus or minus figure.
Confidence intervals
In addition, SE can be expressed with a confidence interval, which estimates a range of data where a parameter of the entire population is most likely located. This type of presentation is considered better for non-technical readers since it doesn’t rely on them doing any calculations.
Follow the following steps to calculate the confidence interval for your study:
- To calculate the confidence interval from the standard error and the mean, you also need to set a confidence level first. The confidence level is the opposite and thus complementary to the level of significance. Meaning that if you set your significance level on the standard of 5%, the level of confidence is 95%.
- For the confidence interval, you then need the corresponding z-value, which can be found in a statistical table. For a confidence level of 95%, the z-value is 1.96.
- In the next step, you multiply the z-value and your standard error, resulting in the standard deviation of the entire population.
- Lastly, you add and subtract this population standard deviation from your sample mean to get the interval, in which the actual mean of the population lies with a probability of 95%.
- ✓ Free express delivery
- ✓ Individual embossing
- ✓ Selection of high-quality bindings
Standard error vs. standard deviation
In some cases, standard error and standard deviation may be confused. Therefore, it is important to have a clear distinction between the two, even though they both describe variability.
- The standard deviation measures the average difference between each sample value and the mean of the study’s sample.
- The standard error measures the average difference between the mean of different (fictional) samples and the actual mean of the population.
FAQs
SE is a measure of statistical accuracy that is equal to the standard deviation. It defines the deviation of multiple fictional sample means from the actual population mean.
It helps to gain a rapid understanding of how representative a sample might be. If the standard error is low, the sample is most likely very representative, while a high standard error connects with low validity.
The lower the number, the more reliable the sample data is likely to be.
No, SE is the umbrella term for every standard error, while SEM is a specific type that defines the standard error of the mean.
