Flowcharts are valuable tools for understanding and organizing complex information, making them essential for numerous fields. In statistics, flowcharts help simplify data analysis procedures by breaking down tasks and highlighting decision points, allowing for a clearer interpretation of data-driven processes. Diagrams like flowcharts are also effective for communicating statistical methodologies, making them accessible to audiences at all levels of expertise.
Definition: Flowchart
A flowchart is a graphical tool used to systematically represent the sequence and logic of a process and is one of the essential tools of quality control. Each step in the process is represented within a standardized symbol, with steps connected by lines and arrows indicating direction. This setup enables viewers to easily follow the flowchart and understand the process from start to finish. In scientific and engineering contexts, flowcharts facilitate analysis, process optimization, and communication by visually organizing complex workflows, enhancing clarity and accuracy in both qualitative and quantitative assessments.
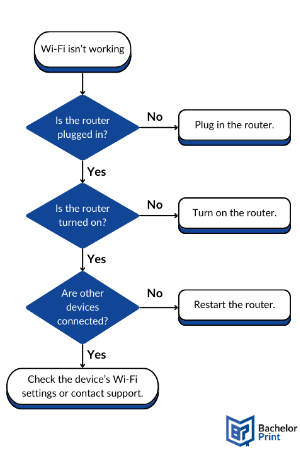
Here’s a simple flowchart illustrating the steps of troubleshooting a non-working Wi-Fi connection.
History
Flowcharts trace back to the early 20th century as a tool for streamlining and visualizing processes.
Engineers Frank and Lillian Gilbreth presented the “Process Chart” to the American Society of Mechanical Engineers (ASME), laying the foundation for modern flowcharts.
Allan H. Morgensen, industrial engineer, refined Gilbreth’s tools for the manufacturing process, making work more efficient for business people.
ASME adopted standardized symbols for Flow Process Charts, formalizing their structure and usage, derived from Gilbreths’ original work.
Herman Goldstine and John Van Neumann used flowcharts to develop computer programs, leading to their widespread use for programming and algorithms.
Flowcharts are popular and widely used across fields like software development, engineering, education, and business, valued for their ability to simplify and communicate complex processes.
Over time, flowchart diagrams evolved into a universal tool for process mapping, supporting efficiency and clarity in diverse applications.
- ✓ Free express delivery
- ✓ Individual embossing
- ✓ Selection of high-quality bindings
Symbols
Flowchart symbols are standardized shapes that represent different steps, actions, or decision points in a process. Each symbol has a specific meaning that helps to structure complex workflows into clear, logical sequences. These symbols enhance the readability and usability of flowcharts, making it easier for viewers to understand the entire process at a glance.
| Symbol | Name | Function |
 |
Start/End symbol | Marks the beginning or end of a process. |
 |
Process symbol | Represents a process step or a sub-process within a larger process. |
 |
Document symbol | Represents a single document. |
 |
Multiple documents symbol | Represents multiple documents used in a process. |
 |
Decision symbol | Represents a decision point where the process can branch based on the answer. |
 |
Input/Output symbol | Used for input or output operations. |
 |
Manual input symbol | Indicates a point where information is manually entered by a person. |
 |
Preparation symbol | Represents a setup step needed before moving forward in the process. |
 |
On-page connector symbol | Used to connect flow lines on the same page (containing the same letter). |
 |
Off-page connector symbol | Used to connect points on different pages (containing the same letter). |
 |
Or symbol | Indicates the process can flow in more than two branches. |
 |
Summoning junction symbol | Used when multiple sub-processes converge into a single process. |
 |
Merge symbol | Used when multiple process paths merge into a single process. |
 |
Collate symbol | Indicates the organization of multiple items into a standard format. |
 |
Sort symbol | Indicates a sorting step where items are organized based on certain criteria. |
 |
Subroutine/Predefined symbol | Shows a set of steps defined elsewhere, used to reference a predefined process within a larger flowchart. |
 |
Manual loop symbol | Indicates a loop in the process that requires manual intervention. |
 |
Loop limit symbol | Represents the maximum number of times a loop or repetitive process can occur. |
 |
Delay symbol | Shows a pause or delay in the process. |
 |
Data storage/Stored data symbol | Represents storage of data in a specific location. |
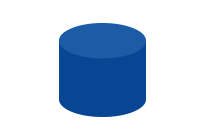 |
Database symbol | Indicates a database or data source. |
 |
Internal storage symbol | Used for data stored internally within a system. |
 |
Display symbol | Represents the display or output of information to a user. |
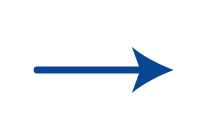 |
Flow line/Flow arrow | Shows the direction and sequence of steps in the process, connecting symbols. |
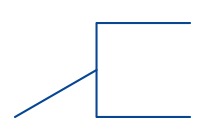 |
Annotation/Comment symbol | Used to add notes, comments, or explanations within the flowchart. |
Use
In any field, flowcharts simplify complex processes by visually breaking them into clear, sequential steps. This approach aids in planning, communication, and troubleshooting, making workflows easier to understand and manage. They help identify bottlenecks, improve efficiency, and ensure consistency, making them useful tools for documenting, optimizing, and training across various applications. Below, you’ll find out how flowcharts are applied across specific fields.
Flowcharts help clarify complex processes, theories, and methodologies by visually organizing information in a logical sequence. They can break down research designs, illustrate theoretical frameworks, or map out argument structures, making content easier to follow and understand. By providing a clear visual representation, flowcharts enhance the reader’s comprehension, support structured analysis, and improve the overall flow of ideas, making them valuable tools for dissertations, research papers, and other academic theses.
Flowcharts help programmers map out the logical flow of algorithms and software processes, making it easier to understand, debug, and optimize code. They visually outline steps, conditions, and loops, facilitating clear program structure.
Teachers use flowcharts to explain concepts, processes, and decision-making paths, enhancing student comprehension. They assist in breaking down complex topics and structuring information logically, supporting both teaching and learning.
Flowcharts outline customer journeys, sales funnels, and campaign strategies. They help identify potential decision points and optimize processes, such as lead nurturing, customer onboarding, and content distribution, to improve engagement and conversion rates.
In business operations, flowcharts model workflows, clarify employee roles, and improve process efficiency. They are essential for training, process improvement, and policy implementation, ensuring consistent and effective practices across departments.
Flowcharts map out production steps, quality control processes, and safety procedures, improving efficiency and reducing errors. They help identify bottlenecks, streamline operations, and ensure compliance with safety and quality standards.
Flowcharts, aid engineers in the design and updating of chemical and plant processes. They help assess the life cycle of structures, chart reverse-engineering workflows, and demonstrate phases in the design and prototyping of new structures or products. This ensures accurate planning, efficient troubleshooting, and alignment with technical specifications.
Types
Each type of flowchart is suited to different applications. Below, we’ll explore different forms of flowcharts.
These common types of flowcharts can be found in Sterneckert’s “Critical Incident Management,” Veronis’ “Microprocessors: Design and Applications,” Bohl’s “A Guide for Programmers,” and Fryman’s “Quality and Process Improvement.”
- Data flowchart: Tracks data movement through a system, useful in IT and data management.
- Document flowchart: Maps document flow within a system, often for paperwork-heavy processes.
- Program flowchart: Outlines the steps of a program, focusing on logic and code execution.
- System flowchart: Shows system components working together, used in engineering and software.
- General flowchart: Broadly represents a process, adaptable to many fields.
- Detailed flowchart: Breaks down processes into fine detail, useful for complex workflows.
Here are several examples illustrating the four most common types of flowcharts (data, document, program, and system).
These specialized types of flowcharts can be found in Fryman’s “Quality and Process Improvement” and other sources.
- Decision flowchart: Focuses on decision points to map possible outcomes.
- Logic flowchart: Shows logical rules and sequences, useful for complex decision-making.
- Product flowchart: Maps stages in product development or manufacturing.
- Process flowchart: Highlights each step in a process, ideal for business and manufacturing.
- Specification and description language (SDL) flowchart: Primarily used in telecommunications and software engineering for structured process modeling.
These additional flowchart types have been defined by others and include related diagrams sometimes referred to as flowcharts:
- Swimlane diagram: Divides roles into lanes, showing task flow across departments.
- Workflow flowchart: Visualizes tasks and dependencies, common in project management.
- Event-driven process chain (EPC) flowchart: Maps events and actions in a business process.
- Data flow diagram (DFD), process flow diagram (PFD), BPMN 2.0: Related diagrams for data flow, process mapping, and business models.
Each type addresses specific needs across fields like programming, engineering, and business, making it easier to visualize and manage different processes. The most common kinds of flowcharts offer broad applicability and are widely used for their versatility.
Step-by-step guide
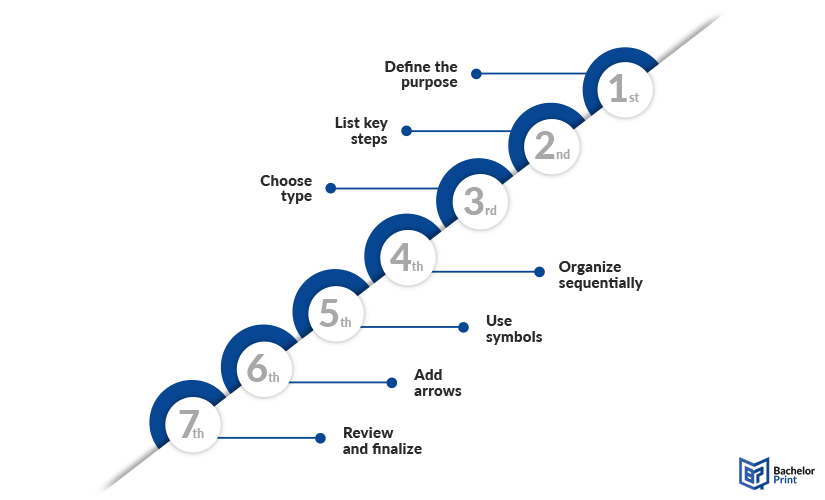
Creating an effective flowchart starts with careful planning and organization. Follow these steps to design a clear, logical structure:
- Define the purpose: Clarify what process the flowchart will represent
- List key steps: Identify all major steps and decisions.
- Choose type: Select the flowchart type best suited to your purpose.
- Organize sequentially: Arrange steps in logical order.
- Use symbols: Apply standard symbols for actions, decisions, and connections.
- Add arrows: Connect steps with arrows to indicate flow.
- Review: Simplify, check for clarity, and finalize with labels if needed.
Software
Popular flowchart software includes Lucidchart, Draw.io, Canva, SmartDraw, and Microsoft PowerPoint. Each offers templates, symbols, and customization options to facilitate professional flowchart design.
FAQs
Run through these steps: Identify the process, list steps, pick a software or draw by hand, select standard symbols, arrange in sequence, and connect with arrows.
“Flowchart” and “flow chart” can be used interchangeably, but the latter spelling is used more commonly.
Common flowchart symbols include ovals (start/end), rectangles (process), diamonds (decision), and arrows (flow).
Yes, Word has shapes and SmartArt. Simply go to the “Insert” tab, click “Shapes,” and under “Flowchart” you’ll find the common symbols used to create one. However, other flowchart makers may be easier to use.