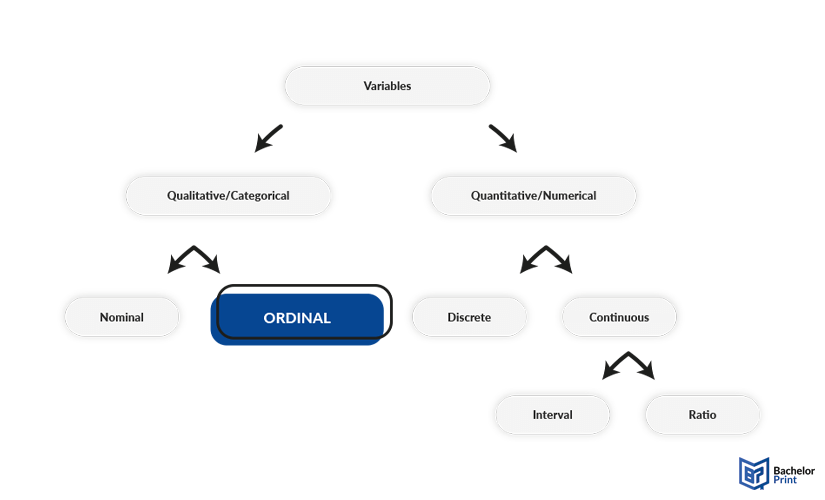
Different types of variables find application in various fields of statistics and research methodology. They substitute an unknown value and help us determine the results we need. One of these variables is the ordinal variable, which is based on ranking qualitative data of, for example, a questionnaire. The following article will give you a deep dive into the topic and visualize it with various examples.
Definition: Ordinal variables
Ordinal variables are a type of categorical variable, where the different categories can be ranked in a hierarchy. The differences between the levels cannot be measured in a quantitative way. Just the same, you can allocate numbers to each scale level, while they cannot be used in mathematical calculations. The rankings can either include levels of satisfaction or agreement, as well as naturally ordered classifications.

Nominal vs. ordinal variables
Both ordinal and nominal variables are subtypes of categorical variables, also called qualitative variables. Both do not hold any quantitative value and therefore cannot be used in calculation. These types of variables merely state facts or subjective evaluations.
Ordinal variable
Ordinal variables always include a hierarchy or ranking. This can be either done by descriptions or numbers, mostly on an odd scale of 3, 5 or 7.
Nominal variable
Nominal variables, on the other hand, consist of distinct categories, which rarely allow you to choose two or more simultaneously. The options to pick from cannot be ranked in hierarchical levels due to being logically separate.
Application of ordinal variables
Ordinal variables are widely used in surveys and questionnaires, especially in the fields of marketing and health insurance, as well as general satisfaction in different sectors. Typically, researchers use a kind of Likert scale with five or more levels of agreement or disagreement to a statement.
To make the results clearer to organize, you can allocate numbers to each level of the scale. However, you need to keep in mind that these are merely substitutes and cannot be used in a mathematical sense.
Analyzing ordinal data
Ordinal data can be analyzed with descriptive and inferential techniques.
Descriptive statistics
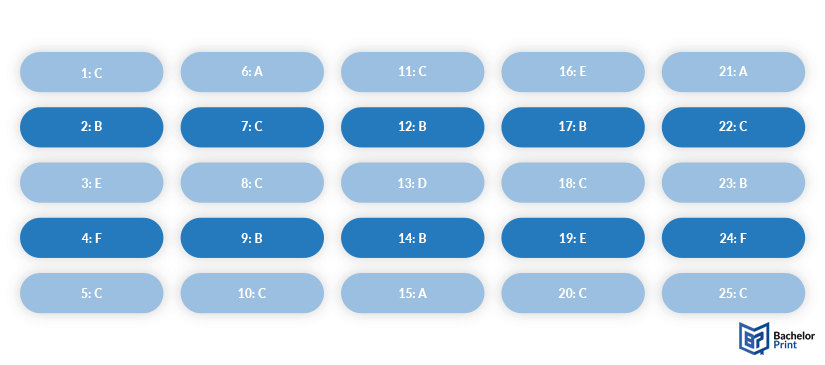
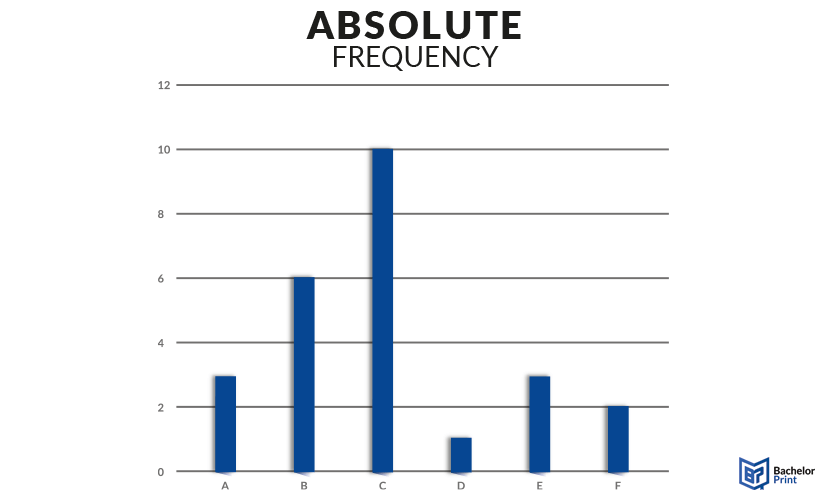
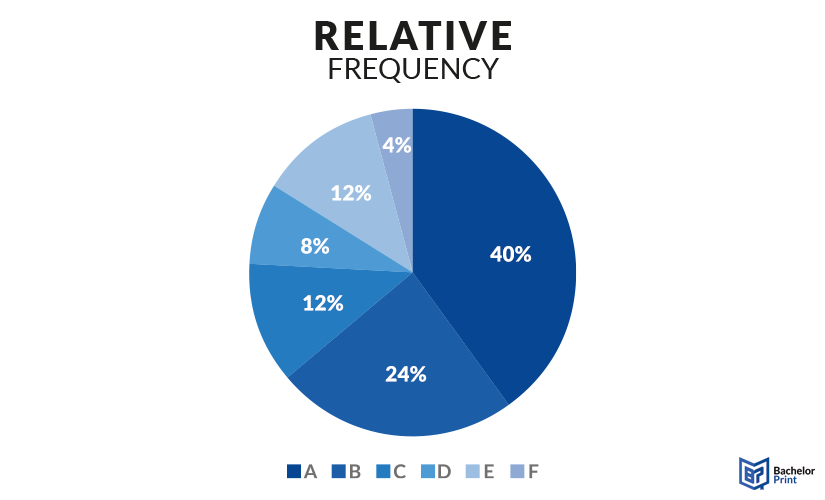
Descriptive statistics only give you an overview of your collected data by frequency distributions, central tendency measurements and the range. These aspects shall be visualized based on this example.

Frequency
The absolute frequency is the number of times each possible outcome has been named or achieved, and is often presented in a bar graph. The relative frequency distribution shows these fractions in percentage. With ordinal variables, it is important that when you present the data in a diagram, the ranking order stays the same. You should never present the bars in a random order like C, F, A, D, B, E.
A
B
C
D
E
F
3
6
10
1
3
2

A
B
C
D
E
F
12%
24%
40%
4%
12%
8%

Central tendency
The central tendency always refers to the middle of a dataset, but in different ways.
- The mode is simply the variable with most votes, which would, in our example, be the grade C as it was achieved by the most students.
In a case where two options appear with the same frequency, you cannot find the mode, since you cannot perform mathematical operations with ordinal variables. Depending on what your research is about and how you use the results, you can still take both “modes” into consideration. - The median, on the other hand, can be found when you line up the absolute frequency and pick the middle one. In this case, it would look as following:
As you can see, the median is C because you take the 13th spot in the line (due to 13 being the exact middle between 1 and 25). Oftentimes, the median is the same as the mode. However, you still need to determine it through this process because, for example, when A would have been the mode, the median would be different. Furthermore, the more ordinal variables you can have, the more likely it is that the median is not the same as the mode due top the shifting center.
In data sets with an even number of results, you cannot find a median for the same reason as with the mode. Even if you code your results with numbers, they are never quantitative and can thus not be used in mathematical calculations.
Range
The range, on the other hand, is simple to determine. You just number all possible results and then subtract the minimum from the maximum. Usually, with ordinal variables, the range is simply the number of options minus 1, since the data has no quantitative value. The range is more useful with numerical variables.
Inferential statistics with non-parametric techniques
Statistical tests for ordinal data always use non-parametric techniques, as parametric ones can only be used with quantitative data. There are in total five possible tests to conduct with ordinal variables.
Mood's median test
In this test, you compare the median of two samples to determine their differences. For example, if you want to compare the satisfaction with customer service of one company to another in the same sector. Therefore, you compare the median of the satisfaction levels and define the differences.
Mann-Whitney U-test
With the Mann-Whitney U-test compares ordinal variables according to the sum of rankings of two independent samples. In the previous example, this test would compare sum up the numbers of the ranks or multiply the rank number with the mentions. As 1 is the best result and 5 the worst, the smaller sum is better.
Wilcoxon signed-rank test
For this test, you need one objective for two or more dependent samples and a hypothesis. The hypothesis is split into two parts, the Null-hypothesis and the alternative hypothesis. The Null-hypothesis is the one you want to prove wrong because the alternative is what you expect. Thereafter, you conduct a test on the Null and alternative hypothesis to find out which one is correct.
Kruskal-Wallis H test
The Kruskal-Wallis H test is an extension to the Mann-Whitney U test, which includes more than two independent data samples. You can still compare the medians of the samples and add the numbers of the ranks for comparison. This also means that the alternative hypothesis can be defined more precisely. Before, the Null-hypothesis was always “no difference” and the alternative hypothesis posed the opposite. Now the alternative hypothesis can define individual objectives like “at least one sample is different.”
Spearman's rank correlation coefficient
The rank correlation coefficient investigates the relationship between two dependent variables and how strong it is. The correlation coefficient can take values from -1 to 1, indicating that the further the value is from 0, the stronger is the relationship.
All of these tests can be applied with ordinal variables, depending on what your study is about and what kinds of results you need.
Other types of variables
- categorical variables and qualitative variables
- quantitative variables and numerical variables
- nominal variables
- ordinal variables
- discrete variables
- continuous variables
- interval variables and ratio variables
- random variables
- latent variables
- composite variables
- binary variables
numerous advantages for Canadian students:
- ✓ 3D live preview of your configuration
- ✓ Free express delivery for every order
- ✓ High-quality bindings with individual embossing

FAQs
Ordinal variables are qualitative variables, which can be ranked. However, the differences between the ranks cannot be defined by numbers.
Ordinal variables find application especially in surveys and questionnaires. An example could be a study about different opinions on whether students should have to do oral exams instead of written tests. Then you would let the participants choose from “agree,” “neutral,” and “disagree.”
While both are types of categorical variables, meaning they do not hold any numerical value, they still have some differences. While nominal variables always consist of logically separate categories, meaning you can often only choose one option, ordinal variables are based on a ranking. This means that ordinal data can be shown on a hierarchical scale, or at least the different categories have some sort of order.
Simply said, there is not much of a difference. In general, ordinal variables are, as the name suggests, the individual variables. This means that in a survey with different levels of satisfaction (very satisfied, satisfied, neutral, dissatisfied, very dissatisfied), each option to select is one ordinal variable. The whole set of ordinal variables including the results of your study are then ordinal data.